Anticoagulants constitute a significant portion of Medicare Part D spending. Previously, we looked into the contribution of anti-diabetics to the Medicare drug coverage program. In this post, we will explore the role of anticoagulants in Medicare Part D spending (2019-2023).
Introduction:
Anticoagulants, or blood thinners, are drugs that reduce the ability of blood to clot easily. They are also effective in breaking pre-existing clots. These drugs are used as preventive treatment for heart attack, stroke, and pulmonary embolism.
Anticoagulants are also prescribed to prevent clot formation in patients with atrial fibrillation, heart valve surgery or replacement, hip or knee replacement, and genetic blood-clotting disorders.
Some examples of these drugs are:
- Eliquis
- Xarelto
- Heparin Sodium
- Warfarin Sodium
- Dabigatran Etexilate
Medicare Part D coverage includes the vulnerable population, i.e., people aged 65 and above or those with a qualifying medical condition or disability. This criterion is significant for understanding anticoagulants’ expenditures in Medicare Part D.
Anticoagulants Medicare Part D Spending (2019-2023):
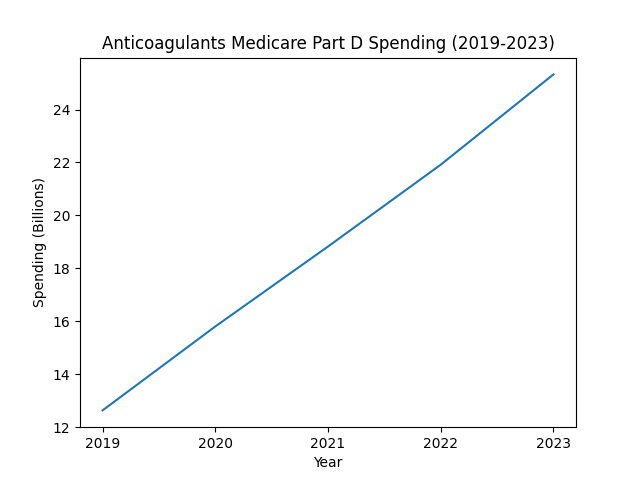
The steep line demonstrates a consistent yearly increase of approximately 3 billion. In 2019, spending was around 12.6 billion, increasing to 15.8 billion in 2020. In 2021, it was approximately 18.8 billion, increasing to 21.9 billion in 2022. In 2023, total spending was around 25.3 billion, marking an increase of approximately 3.4 billion from the previous year.
Anticoagulants Share Percentage:
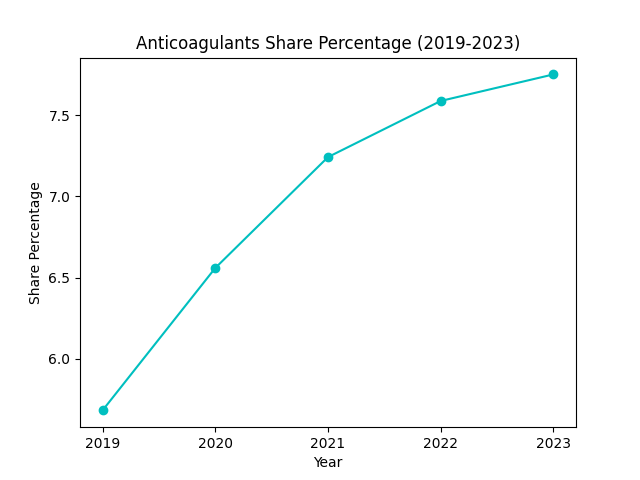
The graph shows the trajectory of anticoagulants’ share percentage in Medicare Part D spending (2019-2023). In 2019, it was around 5.6%, rising to 6.5% in the following year. In 2021, it was 7.2%, increasing to 7.6% in 2022. In 2023, the share percentage was around 7.8%.
It is interesting to note a modest increase in percentage shares in the latter years, while 2020 showed a relatively significant increase of 0.9% from the previous year.
Top Five Anticoagulants:
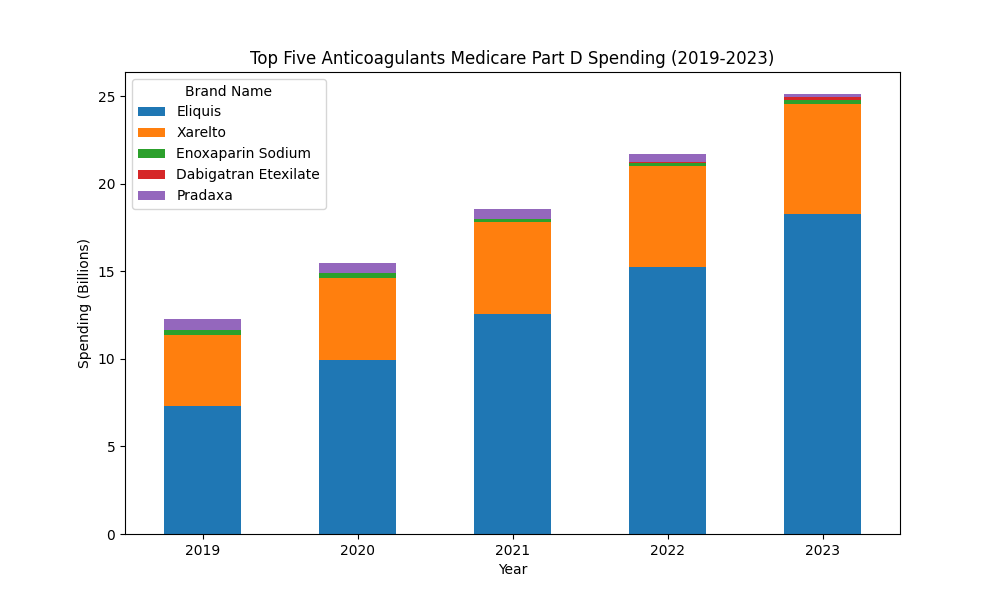
The stacked bar chart reveals the top five anticoagulants dominating the Medicare Part D spending over the years. Eliquis is leading the chart in all years, followed by Xarelto. Both of these drugs account for a large portion of the expenditure on anticoagulants.
Enoxaparin Sodium shows a steady decline in expenditure. Pradaxa follows the same trend as demonstrated by its reduced bar size. Dabigatran Etexilate enters the chart in 2022. But it also shows a decline in 2023.
It is interesting to note that both Pradaxa and Dabigatran Etexilate have the same generic name, i.e., “Dabigatran Etexilate Mesylate”. Thus, these are drugs with the same chemical formula but different manufacturers.
Let’s look into the utilization trend and cost to determine the factors involved in the increased expenditures.
Utilization of Anticoagulants:
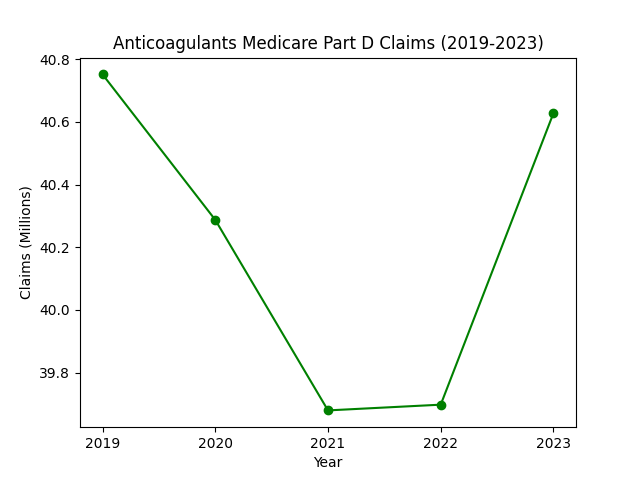
The line chart shows the trend of anticoagulant claims over the years. There is a slight decline in claims till 2021, followed by stabilization in 2022 and a rise in 2023.
The rebound suggests renewed growth in utilization. However, drug-level analysis is required to determine whether the increase is driven by specific therapies or by a change in prescribing trends.
Drug-level Claims Analysis:
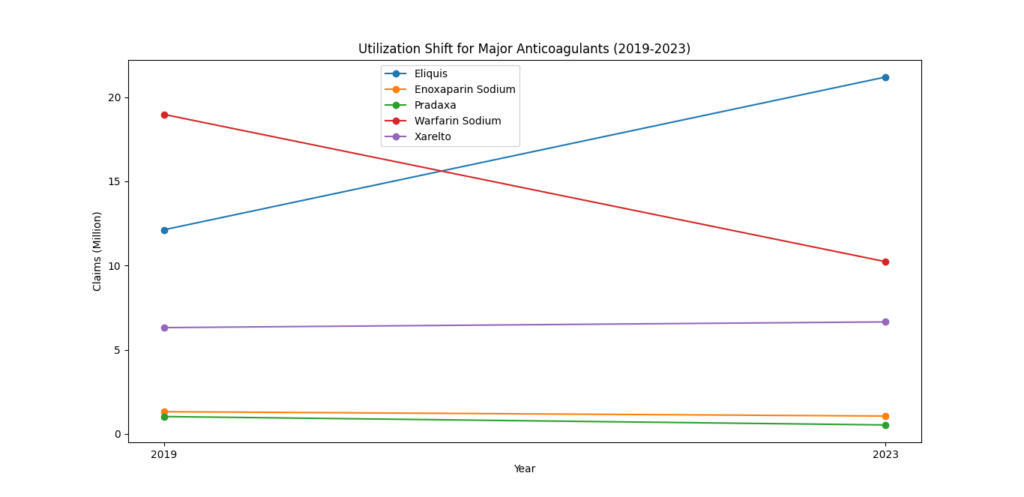
The figure above shows changes in Medicare claims for major anticoagulants. Eliquis claims have risen from 12.1 million to 21.2 million, while Warfarin Sodium claims have declined from approximately 19 million to 10 million. Xarelto shows a slight increase from 6.3 million to 6.7 million.
Enoxaparin Sodium claims declined from 13.2 million to 10.7 million. Pradaxa also shows a decline from 10.3 million to 5.3 million. This trend suggests a preference for Direct Oral Anticoagulants (DOACs) over injectables.
Anticoagulants Cost-Per-Prescription:
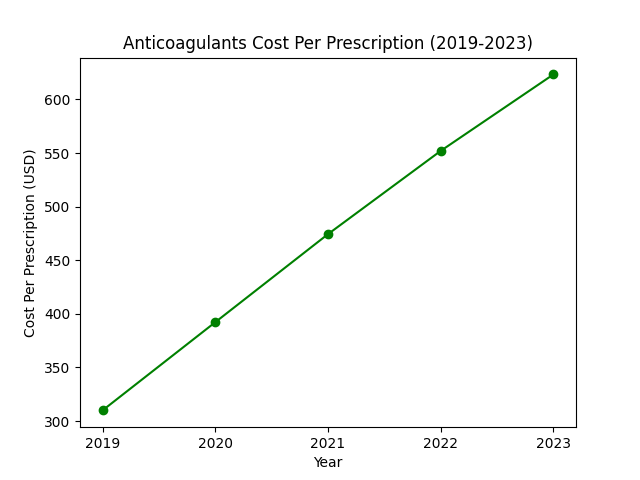
The steep line represents a consistent rise in cost. The cost-per-prescription has almost doubled over the period of five years.
It could be suggested that while total claims have remained consistent, i.e., around 40 million, the increase in cost might be attributed to a shift towards oral anticoagulants, which are relatively expensive.
Conclusion:
Medicare Part D spending on anticoagulants almost doubled from 12.6 billion to 25.3 billion from 2019 to 2023. The total claims have remained relatively stable at around 40 million. The increase in expenditure could be attributed to the change in prescribing trends, where oral anticoagulants are preferred over injectables.
Eliquis has become a popular medication, as evidenced by its rapidly rising claims and spending. Xarelto’s growth has remained relatively stable. All other drugs show a steady decline over the years in both spending and claims.
The analysis revealed that anticoagulants account for a significant share of the total Medicare Part D spending. The increase in spending could be attributed to the adoption of easy-to-administer treatment options, such as oral anticoagulants.
Methodology Appendix:
Data Source:
CMS Medicare Part D Spending By Drug Dataset (2019-2023)
Drug Selection:
The following drugs were included in the analysis:
- Arixtra
- Dabigatran Etexilate
- Eliquis
- Enoxaparin Sodium
- Fondaparinux Sodium
- Fragmin
- Heparin Sodium
- Heparin Sodium in 0.45% NaCl
- Jantoven
- Lovenox
- Pradaxa
- Savaysa
- Warfarin Sodium
- Xarelto
Metrics:
Total Anticoagulants Spending: Sum of annual spending of listed anticoagulants.
Top five Anticoagulants Spending: Annual spending aggregated by drug and ranked by spending.
Anticoagulants Share of Medicare Spending:
Drug-level Claims: Aggregate total claims for the selected drug for the years 2019 and 2023.
Cost Per Prescription:
Limitations:
- This data analysis is based on brand names without considering generic names.
- It is limited in scope and only includes a specific subset of the population enrolled in Medicare Part D.
- No patient data was included in the analysis.
- External factors such as budget and inflation were not considered.
Leave a Reply