Oncology drugs account for a major share of total Medicare Part D spending due to their high cost. In this blog post, we will perform an exploratory analysis of this critical drug class and its contribution to the Medicare drug coverage program.
Introduction:
Cancer is one of the leading causes of morbidity in the elderly and vulnerable population. Advancements in targeted therapies have provided a wide range of treatment options. However, the regulatory studies and research require hefty resources, making oncology drugs expensive.
Some of the medications are:
- Bevacizumab
- Trastuzumab
- Lenalidomide
- Nivolumab
- Ibrutunib
Findings from the analysis for anticancer drugs could be summarized as:
| Year | Total Spending ($B) | Total Claims (M) | Cost Per Prescription ($) | Share of Medicare Spending (%) |
|---|---|---|---|---|
| 2019 | 22.9 | 14.8 | 1546 | 10.3 |
| 2020 | 26.4 | 15.5 | 1699 | 11.0 |
| 2021 | 29.2 | 15.8 | 1849 | 11.3 |
| 2022 | 32.8 | 16.0 | 2042 | 11.4 |
| 2023 | 36.3 | 16.7 | 2171 | 11.1 |
Oncology Drugs Total Medicare Part D Spending (2019-2023)
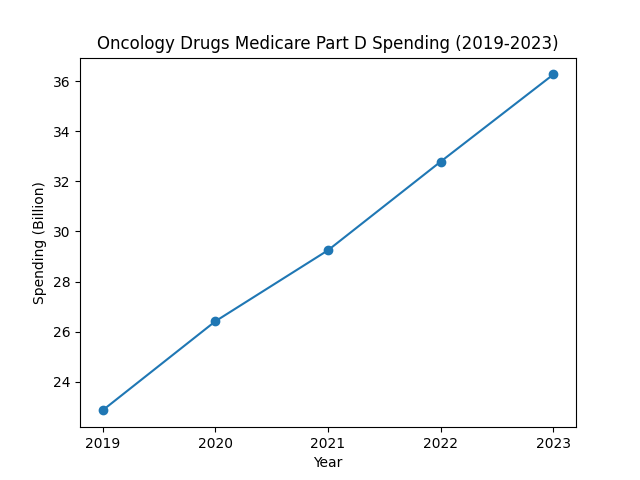
The line chart demonstrates a consistent increase in total spending over the years. In 2019, spending on oncology drugs was around $23 billion. In 2023, spending rose to approximately $36 billion. This suggests that total spending increased by almost 57% over five years.
Anti-Cancer Shares Percentage:
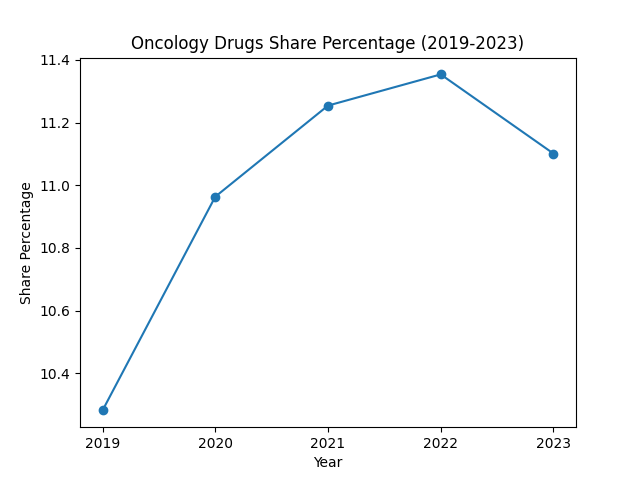
The graph shows that oncology drugs had a consistent increase in share of total Medicare Part D spending between 2019 and 2022, rising from approximately 10.3% to 11.4%. In 2023, there is a slight decline to 11.1%. It might suggest that spending on other drug classes outpaced oncology drugs’ spending in the final year.
Oncology Drugs Claims (2019-2023)
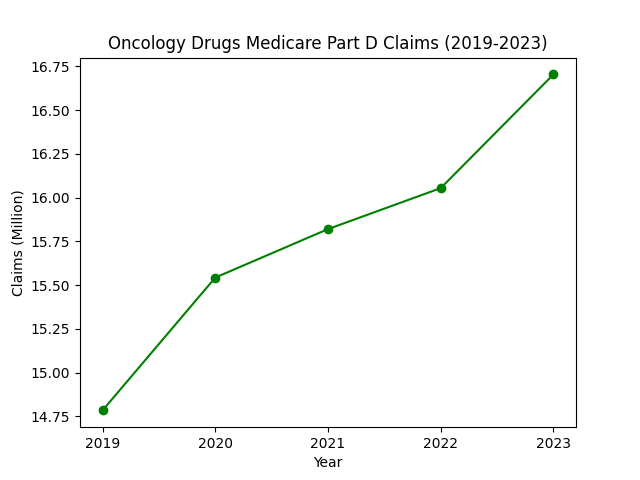
The graph shows a steady increase in claims over the years. The total prescriptions increased from approximately 14.8 million to 16.7 million from 2019 to 2023.
Although this trend might indicate expanded utilization of various oncology therapies, the increase in claims is modest relative to the total spending on oncology drugs. This makes us consider that the cost per prescription might be the major factor behind the increasing cost.
Oncology Drugs Cost-Per-Prescription:
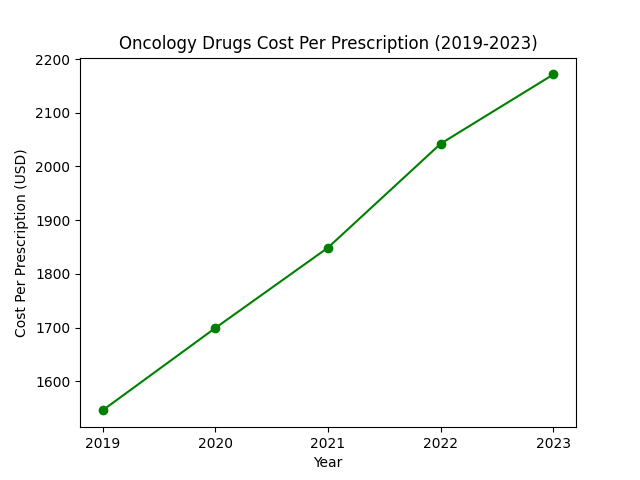
Like other trends, the cost-per-prescription chart for oncology drugs also shows a constant increase over time. The cost increased by approximately 40% from 2019 to 2023. This significant increase in spending per prescription could be attributed to the increasing total expenditure.
Thus, it is safe to assume that the increase in Medicare Part D spending on oncology drugs is primarily due to rising per-prescription cost and not due to the slight increase in the number of claims.
Top Five Oncology Drugs:
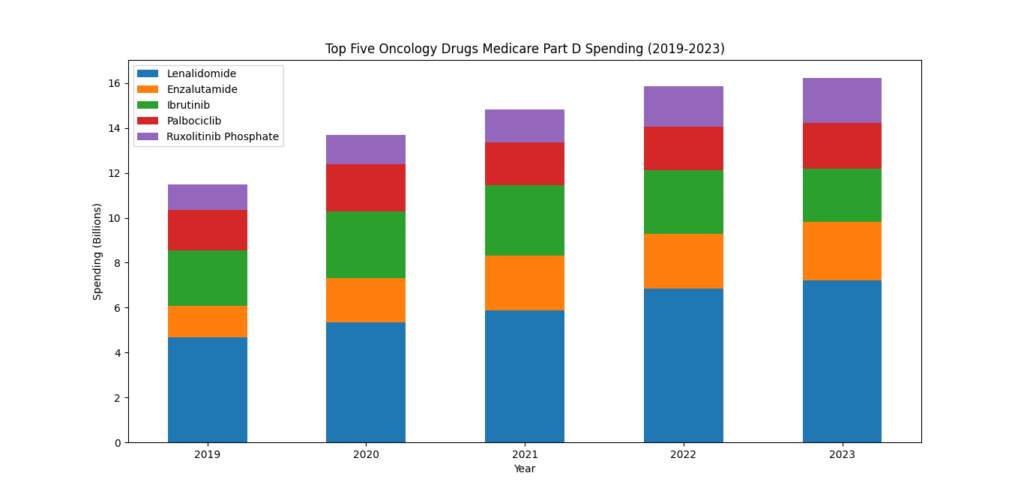
The bar chart shows that the combined spending on the top five leading oncology drugs increased from approximately $11.5 billion in 2019 to over $16 billion in 2023. This trend shows sustained growth over time.
Lenalidomide is leading the chart as it accounted for nearly half of the total spending among the top five drugs. Its expenditure has increased from around $4.7 billion to more than $7.2 billion.
Enzalutamide takes the second spot on the chart, showing steady growth. Its total spending was $1.4 billion in 2019, which increased to $2.6 billion in 2023.
Ibrutinib shows an inconsistent trend. It shows growth from 2019 to 2021, followed by a slight decline between 2022 and 2023. Palbociclib shows an increase in spending from 2019 to 2020. Its spending declines in 2021, followed by a gradual increase in the following years.
Ruxolitinib Phosphate is the smallest contributor yet shows steady growth over the years. Its spending increased from approximately $1.1 billion in 2019 to $2.0 billion in 2023.
Conclusion:
Oncology drugs accounted for a major share of Medicare Part D spending between 2019 and 2023. Total spending on oncology drugs increased from $22.9 billion in 2019 to $36.3 billion in 2023. The analysis indicates that rising cost per prescription was the primary driver of increased spending, while utilization was a relatively modest factor.
Among the top five oncology drugs, Lenalidomide, Enzalutamide, and Ruxolitinib Phosphate exhibited steady growth over the years. Lenalidomide accounted for nearly half of the expenditure in the top five drugs, while Ruxolitinib Phosphate had the smallest contribution. Ibrutinib and Palbociclib showed inconsistent spending trends over the years.
The share analysis showed that oncology drugs consistently accounted for approximately 11% of the total Medicare Part D spending. Oncology drugs accounted for the largest share of Medicare Part D spending compared to the therapeutic classes analyzed in previous posts.
Methodology Appendix:
Data Source:
CMS Medicare Part D Spending By Drug Dataset (2019-2023)
Drug Selection:
A total of 178 oncology drugs were included in the analysis. The list of oncology drugs was compiled using the Cancer Research UK website as a reference and then matched to drugs in the CMS dataset. Supportive care medications (e.g., antiemetics and growth factors) and pain management drugs were excluded from the analysis to focus on anticancer therapies. A complete list of the 178 drugs is available upon request.
Metrics:
Total Oncology Drugs Spending: Sum of annual spending of selected oncology drugs.
Top five Oncology Drugs Spending: Annual spending aggregated by drug and ranked by spending.
Utilization: Sum of oncology drug claims for each year.
Oncology Share of Medicare Spending:
Cost Per Prescription:
Limitations:
- This analysis is based on generic names and doesn’t include brand names.
- This is a collective analysis and doesn’t include a separate classification of drugs.
- Some oncology drugs are also used for other indications; for example, Octreotide is used to treat acromegaly and gastrointestinal conditions. It might lead to a slight exaggeration in the result.
- It includes only a small subset of the total population.
- No patient data were included in the analysis.
- External factors such as budget and inflation were not considered.
Leave a Reply