In the previous post, GLP-1 agonists’ analysis revealed an extraordinary increase of 327% in spending over the years. This enormous increase makes us wonder about the trends of other anti-diabetics. In this post, we will explore the contribution of another drug class named SGLT2 Inhibitors to Medicare Part D spending.
Introduction:
SGLT2 Inhibitors are used to treat type 2 diabetes. They manage blood sugar levels by stopping the reabsorption of glucose in the kidneys. So, the kidneys don’t reabsorb glucose, and it is eliminated through urine. These drugs are also effective in slowing down the progression of kidney disease and heart failure.
Some of the examples are:
- Farxiga
- Jardiance
- Invokana
- Steglatro
- Synjardy
It is interesting to note that some of these drugs are also used in combination with other anti-diabetics. For example, Synjardy is a combination of Empagliflozin (SGLT2 Inhibitor) and Metformin Hydrochloride (biguanide).
SGLT2 Medicare Spending:
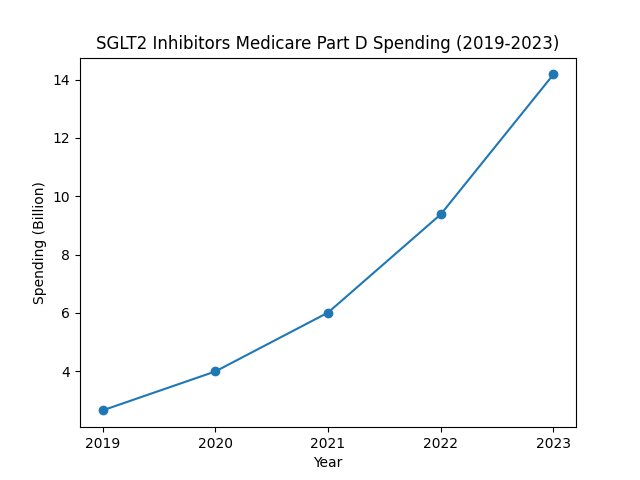
The graph shows a consistent increase in spending over the years. In 2019, spending was around $2.7 billion, increasing to around $4.0 billion in the following year. In 2021, it rose to $6.0 billion, followed by $9.4 billion. The graph shows a maximum rise in 2023, with spending of $14.2 billion, an approximate 51% increase from 2022.
Percentage Growth of SGLT2 Inhibitors:
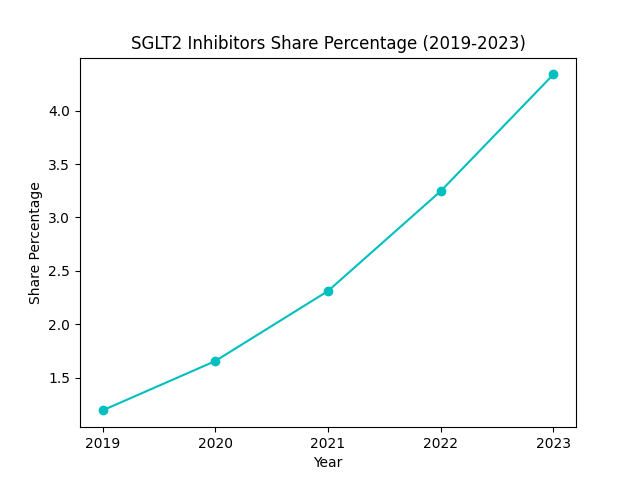
The graph shows the share of SGLT2 inhibitors in total Medicare Part D spending. In 2019, the share percentage was 1.2%, rising to 1.7% the following year. In 2021, it was recorded at around 2.3%, rising to 3.2% and 4.3% in subsequent years.
As discussed earlier, there has been constant growth over the years. However, 2023 shows the maximum growth, closely followed by 2022. This growth might be attributed to the endorsement of SGLT2 inhibitors for the management of heart failure by the American Heart Association(AHA) in 2022 and subsequent experts’ reinforcement of the endorsement in 2023-2024.
These findings lead us to question whether the spending growth is driven by increased utilization or increased cost per prescription.
Utilization of SGLT2 Inhibitors:
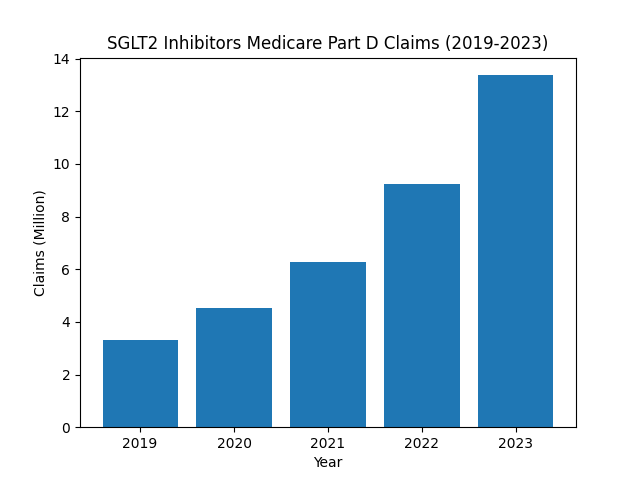
The bar chart shows a consistent growth in claims. In 2023, the Medicare claims increased to 13.4 million from 3.3 million in 2019. This shows an extraordinary increase of around 306%. As mentioned earlier, this can be attributed to the approval of SGLT2 inhibitors for the management of heart failure and kidney disease.
Cost Per Prescription:
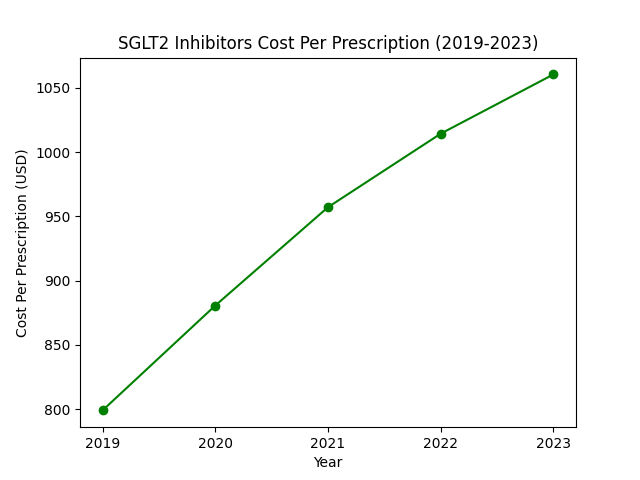
The line chart shows an initial cost of $799 in 2019, rising to $1061 in the final year of the study period (2023). This represents an increase of around 33% in cost per claim over the years.
It could be assumed that utilization increased almost fourfold, far exceeding the one-third increase in per-prescription costs. Thus, the drug class’s Medicare Part D expenditures are largely driven by the expanding utilization.
Top Five SGLT2 Inhibitors in Medicare Part D:
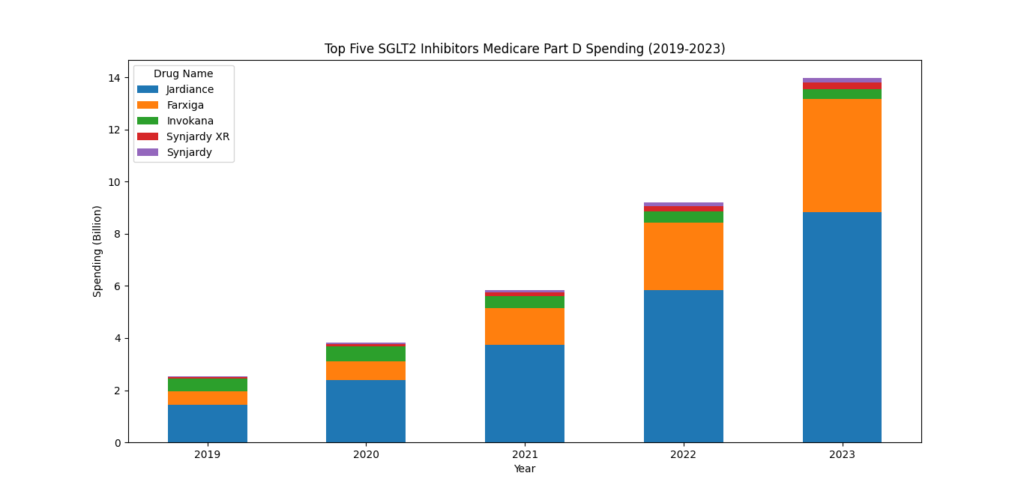
The stacked bar graph provides a glimpse into the top five SGLT2 Inhibitors in the Medicare drug coverage program from 2019 to 2023.
Jardiance has been leading the chart throughout the years. Farxiga is taking the second spot. Both of these drugs have shown a consistent growth pattern over the years. On the contrary, Invokana shows initial growth but then declines from 2021 onwards.
It is noteworthy that both Synjardy and Synjardy XR contain the same drug combination. However, Synjardy XR contains extended-release Metformin and is prescribed only for adults. Synjardy is an immediate-release medication approved for both adults and children above ten years old. Both of these show steady growth over the years.
SGLT2 Inhibitors data in Medicare Part D (2019-2023) could be summarized as:
| Year | Total Spending ($B) | Total Claims (M) | Cost Per Prescription ($) | Share of Medicare Spending (%) |
|---|---|---|---|---|
| 2019 | 2.7 | 3.3 | 799 | 1.2 |
| 2020 | 4.0 | 4.5 | 881 | 1.7 |
| 2021 | 6.0 | 6.3 | 957 | 2.3 |
| 2022 | 9.4 | 9.2 | 1014 | 3.2 |
| 2023 | 14.2 | 13.4 | 1061 | 4.3 |
Conclusion:
SGLT-2 Inhibitors have shown a 426% increase in Medicare Part D spending from 2019 to 2023. This extraordinary growth might be linked to the drugs’ effectiveness in various disease management. The data suggest that utilization is the primary factor responsible for the increase in expenditure.
Jardiance has emerged as the most popular treatment choice, followed by Farxiga. Invokana has shown an uneven trend. Both Synjardy and Synjardy XR show slight yet stable growth over the time period.
Analysis revealed that single-agent drugs are preferred over combination products; i.e., Jardiance or Farxiga are more prescribed as compared to Synjardy. This might suggest that single-agent drugs have better or the same effectiveness as combination drugs.
Methodology Appendix:
Data Source:
CMS Medicare Part D Spending By Drug Dataset (2019-2023)
Drug Selection:
The following drugs were included in the analysis:
- Farxiga
- Glyxambi
- Inpefa
- Invokamet
- Invokamet XR
- Invokana
- Jardiance
- Qtern
- Segluromet
- Steglatro
- Steglujan
- Synjardy
- Synjardy XR
Metrics:
Total SGLT2 Inhibitors Spending: Sum of annual spending of listed SGLT2 Inhibitors.
Top five Drug Spending: Annual spending aggregated by drug and ranked by spending.
Utilization: Sum of claims for SGLT2 inhibitors for every year.
SGLT2 Inhibitors Share of Medicare Spending:
Cost Per Prescription:
Limitations:
- It is a collective analysis of SGLT2 inhibitors and is not focused on individual drugs.
- Analysis is limited in scope and does not include the public at large.
- No patient data was included in the analysis.
- External factors such as budget and inflation were not considered.
Leave a Reply