Biologics are drugs produced from living organisms or containing specific components derived from living organisms. Biosimilars are products similar to biologics in efficacy, composition, and mechanism of action. Biosimilars are considered derivatives of biologics. They are manufactured after the reference product’s (Biologic) patent license expires.
In this post, we will examine multiple biologics and analyze spending trends for the biosimilars in Medicare Part D. Our primary focus is overall spending, claims trends, and cost per prescription from 2019 to 2023.
Biologics Markets Included in the Analysis:
The following five biologic reference products with biosimilars were chosen for the analysis:
| Reference Biologic | Market | Major Biosimilars |
|---|---|---|
| Humira | Adalimumab | Amjevita, Cyltezo, Hadlima, Hyrimoz, Yuflyma, Yusimry |
| Remicade | Infliximab | Avsola, Inflectra, Renflexis |
| Avastin | Bevacizumab | Alymsys, Mvasi, Zirabev |
| Rituxan | Rituximab | Riabni, Ruxience, Truxima |
| Herceptin | Trastuzumab | Herzuma, Kanjinti, Ogivri, Ontruzant, Trazimera |
A list of biosimilar products and their respective biosimilars was compiled using publicly available biologic drug resources. However, pain management and supportive care drugs were excluded for the sake of convenience. The unit of analysis is the biologic market name rather than brand names; e.g., adalimumab is used instead of Humira.
Biologics and Biosimilars Spending:
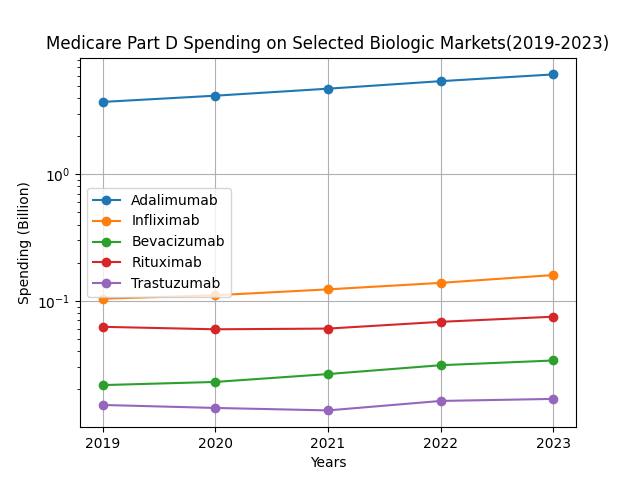
The above graph shows a massive difference between Adalimumab spending and other markets. A logarithmic y-axis was used to accommodate this huge difference in spending.
Adalimumab remained the largest market by spending throughout the years. Its spending increased from $3.7 billion in 2019 to $6.1 billion in 2023. Infliximab emerged as the second-largest market, with spending increasing from $103.8 million to $159 .7 million from 2019 to 2023. Bevacizumab spending increased from $21.6 million to $33.73 million. Rituximab spending increased modestly from $62.2 million to $74.8 million over the years. Trastuzumab was the smallest market throughout the years, with spending increasing from $15.02 million to $16.8 million, demonstrating minimal growth. The Trastuzumab line also shows a small dip in 2020 and 2021, followed by growth in the subsequent years.
The total spending could be summarized as:
| Market Name | 2019 | 2020 | 2021 | 2022 | 2023 |
|---|---|---|---|---|---|
| Adalimumab | $3.7 B | $4.2 B | $4.7 B | $5.4 B | $6.1 B |
| Infliximab | $103.8 M | $110.5 M | $123.0 M | $138.4 M | $159.7 M |
| Bevacizumab | $21.6 M | $22.8 M | $26.4 M | $30.9 M | $33.73 M |
| Rituximab | $62.2 M | $59.5 M | $60.3 M | $68.2 M | $74.8 M |
| Trastuzumab | $15.02 M | $14.2 M | $13.6 M | $16.2 M | $16.8 M |
Adoption of biosimilars:
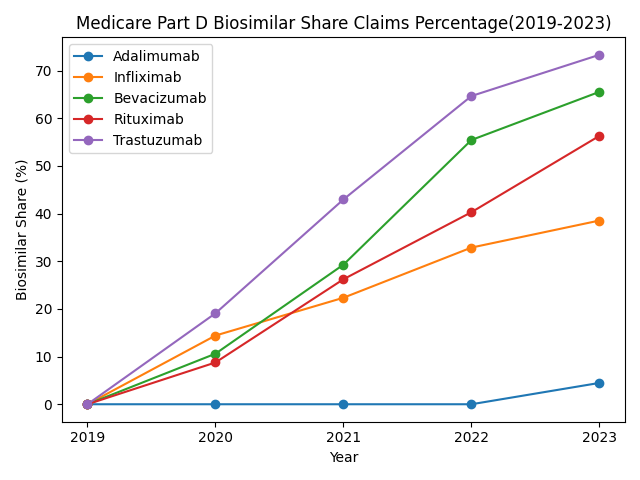
In order to determine the use of biosimilars, we need to find the share of biosimilars in the biologic market. The graph shows varying degrees of biosimilar adoption in all five markets. Trastuzumab showed the most rapid growth trajectory, with biosimilars’ share increasing from 0% to approximately 73% in 2023. Bevacizumab and Rituximab also showed significant adoption, with the claims rising to 66% and 56%, respectively. Infliximab showed a gradual yet consistent increase in claims over the years, rising to 39% in 2023.
Adalimumab emerged as an outlier, showing minimal adoption at 4.5% in the final year. This might lead to the assumption that the reference product is leading the spending trend in the adalimumab market. However, claim share doesn’t necessarily translate into equivalent spending share. Further analysis is needed to determine the spending share of the reference products and their biosimilars.
Are Biosimilars Driving the Overall Expenditures?
Adalimumab:
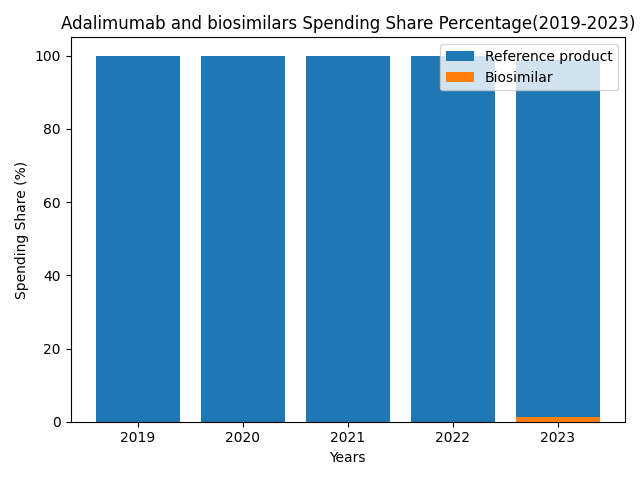
The Adalimumab bar chart shows that its biosimilars didn’t enter the scene till 2023. Many of its biosimilars were already approved by the FDA during the study period. However, Medicare did not include them in the drug coverage program till 2023. Thus, the spending share percentage for adalimumab biosimilars is around 1.2%.
Bevacizumab:
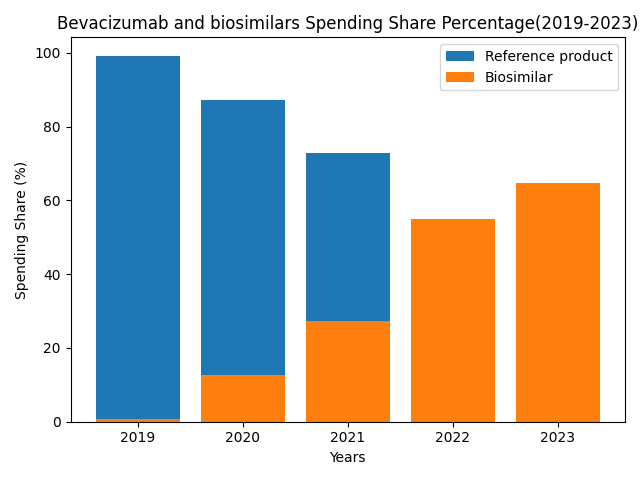
The bevacizumab chart shows impressive growth in spending share percentage. The initial spending share percentage is 0.8%, rising to 64.6% in 2023. It represents the increase in expenditure on bevacizumab biosimilars over the years.
Infliximab:
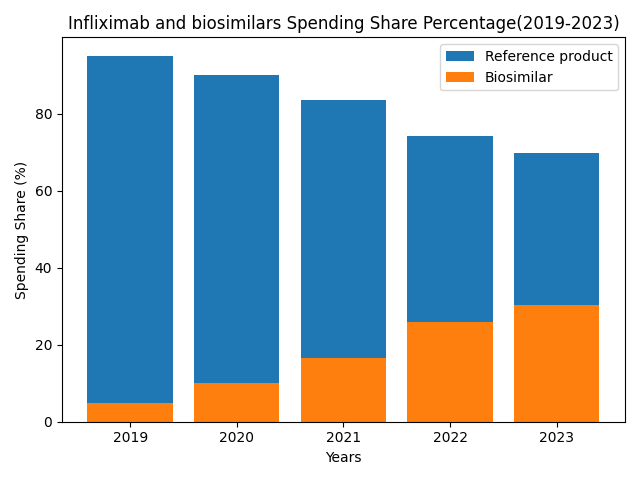
Infliximab biosimilars show significant growth in spending. In 2019, the spending share percentage was around 4.9%, increasing to 30.3% in 2023.
Rituximab:
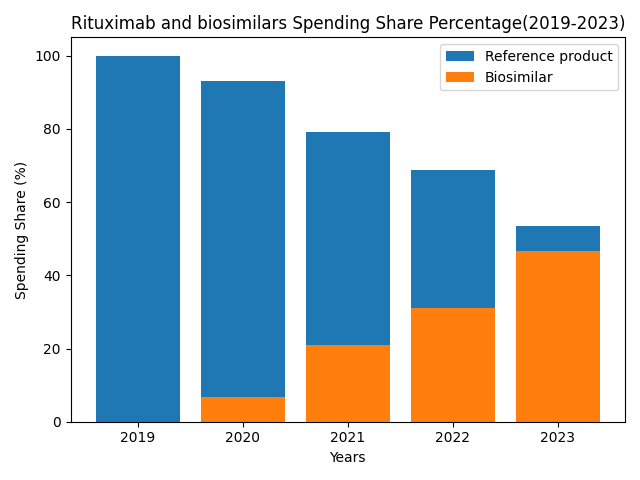
The bar chart shows significant growth over the years. Its biosimilars were not in the CMS dataset in 2019, with the reference product dominating the bar chart. However, biosimilars grew steadily in later years, with the spending share percentage rising to around 46.6% in 2023.
Trastuzumab:
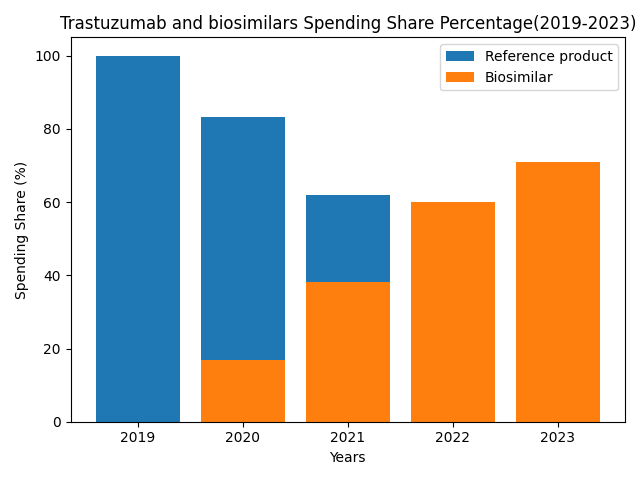
Trastuzumab biosimilars showed the most impressive growth over the years. They were included in the CMS dataset in 2020 with a spending share percentage of around 16.8%, rising to 70.8% in 2023.
Thus, the data suggest that biosimilars are leading the spending trend in three biologic markets (Bevacizumab, Rituximab, Trastuzumab). These findings raise the question of whether biosimilars are cheaper or more expensive than their specific reference product.
Biologics and Biosimilars Cost Per Prescription:
Adalimumab:
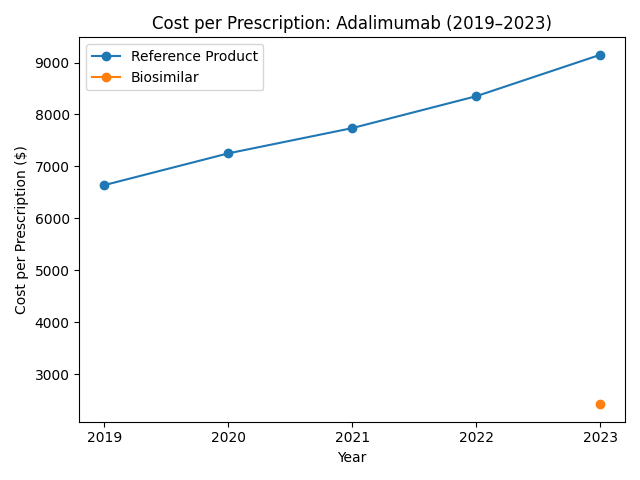
The Adalimumab reference product (Humira) cost per prescription increased from $6639 in 2019 to $9148 in 2023. Its biosimilars were not part of the CMS dataset from 2019 to 2022. The line chart shows that biosimilars’ cost per prescription in 2023 was around $2420.
Bevacizumab:
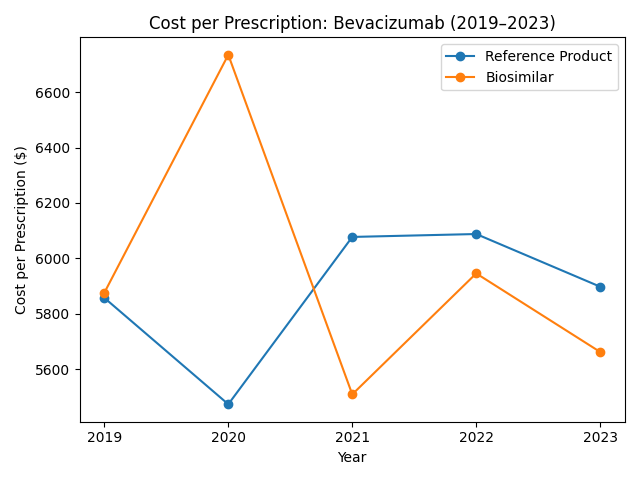
The reference product (Avastin) cost per prescription was around $5858 in 2019 and increased to $5898 in 2023. The biosimilars’ line chart shows a varying trend. The cost increased from $5876 in 2019 to $6734 in 2020, as shown by the spike in the graph. The cost fell to $5510 in 2021 and rose to $5946 in 2022. The cost per prescription was $5663 in 2023.
Infliximab:
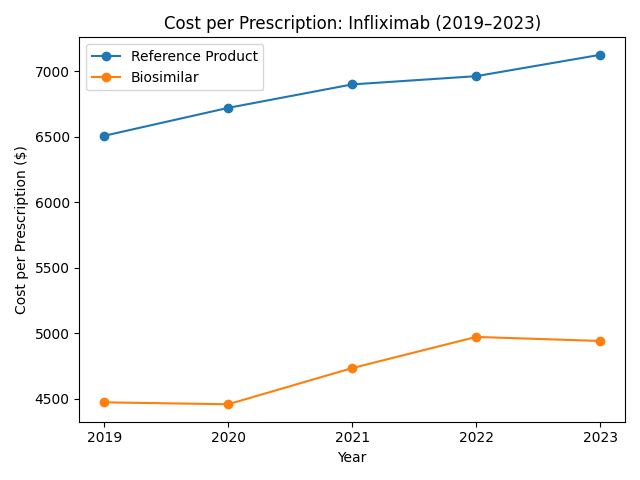
The biologic product (Remicade) cost per prescription was around $6508 in 2019, rising to $7126 in 2023. Its biosimilars declined slightly from $4475 in 2019 to $4460 in 2020. The next two years showed a consistent increase in cost, i.e., $4736 and $4974, respectively. A slight decline is seen in 2023; the cost per prescription is around $4943.
Rituximab:
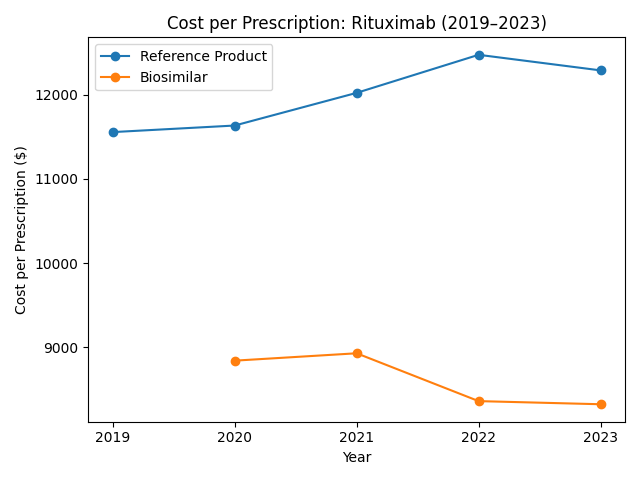
The reference product (Rituxan) shows a consistent increase in price per prescription from $11558 to $12477 (2019-2022). In 2023, the cost per prescription decreased to $12292. Its biosimilars are analyzed from 2020 to 2023. A varying trend is seen, where the price increased from $8839 to $8927 (2020-2021). The line chart then shows a decline over the next two years, where the cost per prescription was approximately $8358 and $8321 (2022-2023).
Trastuzumab:
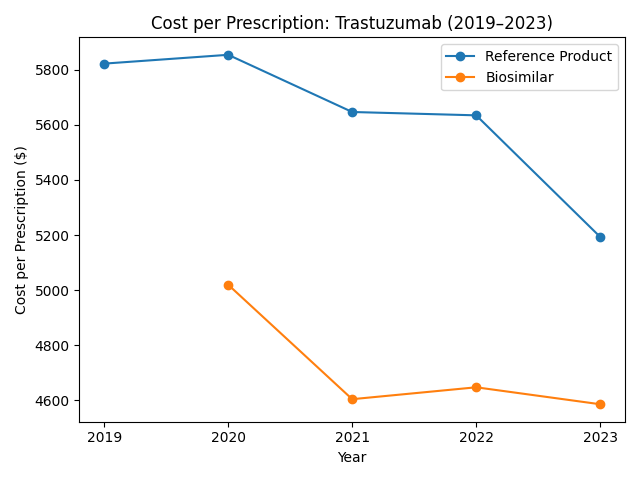
The biological product (Herceptin) cost per prescription shows a varying trend. In 2019, the cost was around $5823, increasing to $5855. The price was reduced to around $5647 in 2020, $5635 in 2021, and $5193 in 2023. Its biosimilars per prescription cost was $5020 in 2020. In 2021, the cost was around $4604, rising to $4647 in 2022. The cost per prescription was $4586 in the final year of the study.
The analysis revealed a varying trend in cost per prescription over the years. However, utilization analysis is required to understand the full picture of overall Medicare Part D spending.
Biologics and Biosimilars Utilization:
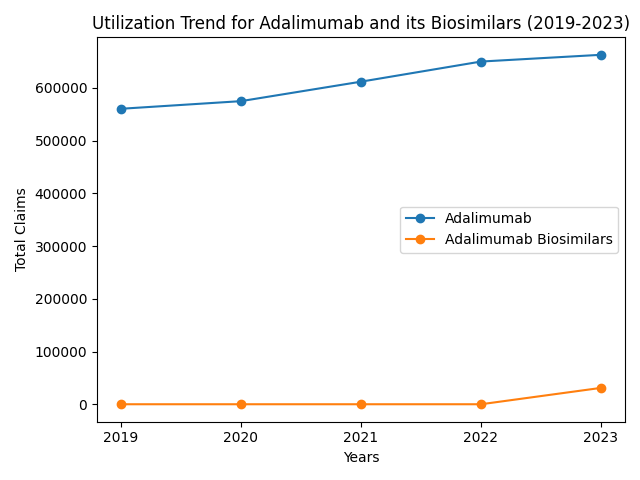
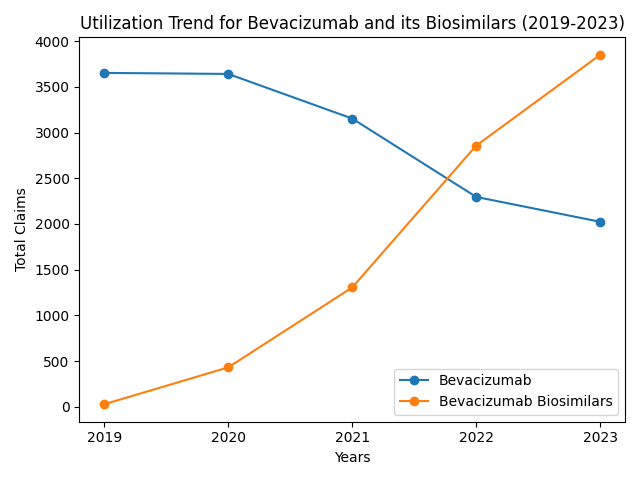
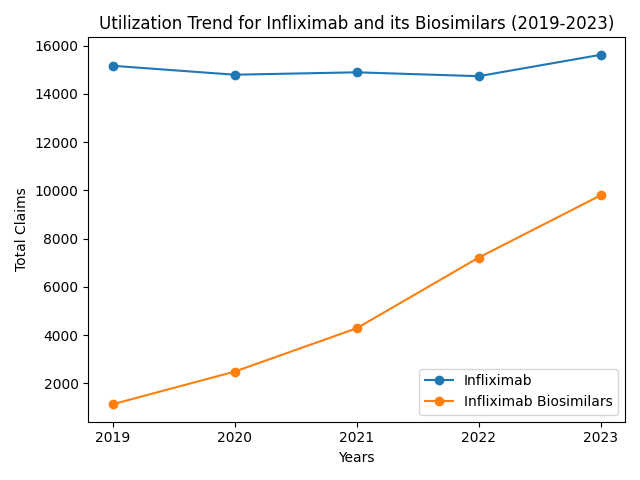
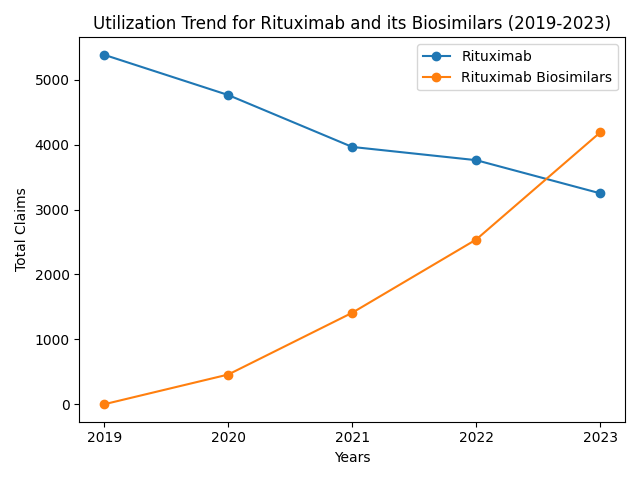
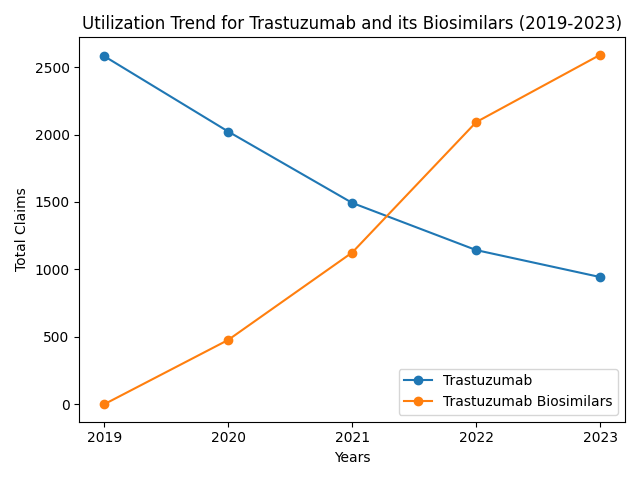
Total claims for each market could be summarized as:
| Market Name | 2019 | 2020 | 2021 | 2022 | 2023 |
|---|---|---|---|---|---|
| Adalimumab | 560246 | 574715 | 611628 | 649793 | 662581 |
| Adalimumab Biosimilars | 0 | 0 | 0 | 0 | 31035 |
| Bevacizumab | 3652 | 3641 | 3153 | 2296 | 2024 |
| Bevacizumab Biosimilars | 29 | 432 | 1306 | 2857 | 3850 |
| Infliximab | 15160 | 14790 | 14890 | 14729 | 15615 |
| Infliximab Biosimilars | 1138 | 2491 | 4285 | 7212 | 9793 |
| Rituximab | 5386 | 4766 | 3966 | 3762 | 3251 |
| Rituximab Biosimilars | 0 | 458 | 1410 | 2539 | 4190 |
| Trastuzumab | 2581 | 2022 | 1493 | 1143 | 943 |
| Trastuzumab Biosimilars | 0 | 477 | 1125 | 2092 | 2591 |
Utilization patterns varied across the five biologic markets. The Adalimumab reference product dominated the chart, with its claims increasing from 560,246 in 2019 to 662,581 in 2023. Its biosimilars accounted for only 4.5% of market claims in 2023.
Reference-product claims declined significantly for Bevacizumab, Rituximab, and Trastuzumab, indicating increased biosimilar utilization. Infliximab showed an intermediate pattern, with relatively stable reference-product claims alongside substantial growth in biosimilar claims. Thus, claims increased across all five markets between 2019 and 2023.
Percentage Change in Medicare Part D Spending, Utilization and Cost Per Prescription (2019-2023):
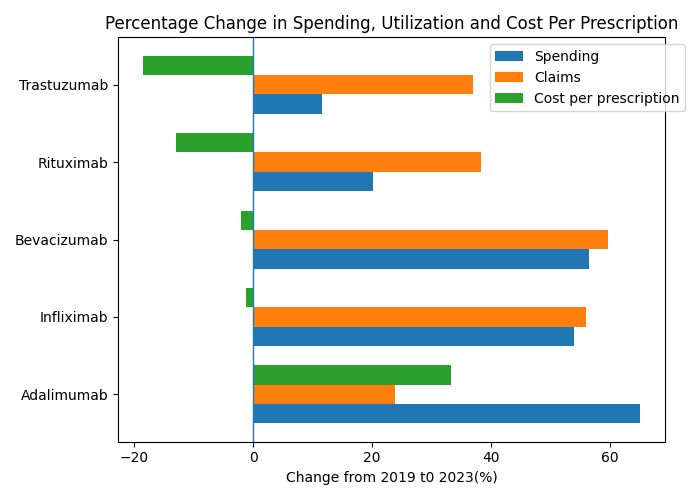
This horizontal bar chart shows percentage changes in spending, utilization, and cost per prescription for the selected five markets over the years. Adalimumab leads the chart with a 65% increase in total spending, a 23.8% increase in claims, and a 33.8% increase in cost per prescription. Bevacizumab is second on the list, with an increase of 56.4% in spending and a 59.6% increase in claims. However, its cost per prescription is -2.0%, indicating a decline. Infliximab shows a similar trend: total spending increased by 53.9%, claims increased by 55.9%, and cost per prescription is -1.3%.
Rituximab shows a 20.2% increase in spending, a 38.2% rise in claims, and a -13.0% change in cost per prescription. Similarly, Trastuzumab shows an increase of 11.6% in spending, a 36.9% increase in claims, and a significant decline in cost per prescription, denoted by -18.5%.
These findings indicate that no single factor is responsible for the increase in expenditures. Both components, i.e., cost per prescription and utilization, collectively determine overall Medicare Part D spending in the five markets.
Key Takeaways:
The findings could be summarized as:
- Biosimilar adoption varied across markets.
- Some FDA-approved biosimilars were not in the CMS dataset in the initial years.
- Trastuzumab had the highest biosimilar claim share in 2023, while Adalimumab had the lowest.
- Reference products’ utilization decreased in multiple markets.
- Total utilization increased across the five markets.
- Cost per prescription declined in four markets.
- Spending steadily increased across five markets.
- Both cost per prescription and utilization significantly contribute to the overall spending.
Conclusion:
Biosimilars adoption varied across all five biologic markets in Medicare Part D. By the end of the study period in 2023, biosimilars adoption increased across markets, especially for Trastuzumab, Bevacizumab, and Rituximab. Subsequently, overall spending increased across all five markets.
The analysis further revealed that the relationship between biosimilar adoption and spending is complex. It is difficult to find a correlation between increased expenditure and increased biosimilar adoption. Changes in utilization and cost per prescription simultaneously impacted total spending in all five markets.
Methodology Appendix:
Data Source:
CMS Medicare Part D Spending By Drug Dataset (2019-2023)
Drugs:
- Humira
- Amjevita
- Cyltezo
- Hadlima
- Hyrimoz
- Yuflyma
- Yusimry
- Remicade
- Avsola
- Inflectra
- Renflexis
- Avastin
- Alymsys
- Mvasi
- Zirabev
- Rituxan
- Riabni
- Ruxience
- Truxima
- Herceptin
- Herzuma
- Kanjinti
- Ogivri
- Ontruzant
- Trazimera
Metrics:
Total Spending: Sum of annual spending for selected markets.
Biosimilar Claims Share Percentage:
Biosimilar Spending Share Percentage:
Cost Per Prescription:
Utilization: Sum of claims per year.
Percentage Change:
Limitations:
- The analysis includes only a selective population enrolled in the Medicare drug coverage program from 2019 to 2023.
- This is a descriptive analysis and doesn’t establish causal relationships between various metrics.
- Some biosimilars were not part of the analysis in the initial years.
- The analysis doesn’t consider other factors such as regulatory changes, product mix, treatment plans, and market dynamics.
Leave a Reply