In the previous post, we discussed how Medicare Part D spending increased by 48% from 2019 to 2023. We noticed that a small number of drugs accounted for a large share of total expenditures. This leads us to wonder which drugs are the primary drivers of the spending growth. Were all of these drugs consistent over the five years?
In this blog post, we will explore the drugs that made it onto the top ten list over the years and how their growth changed with time.
Which Drugs Contributed the Most to Spending Growth?
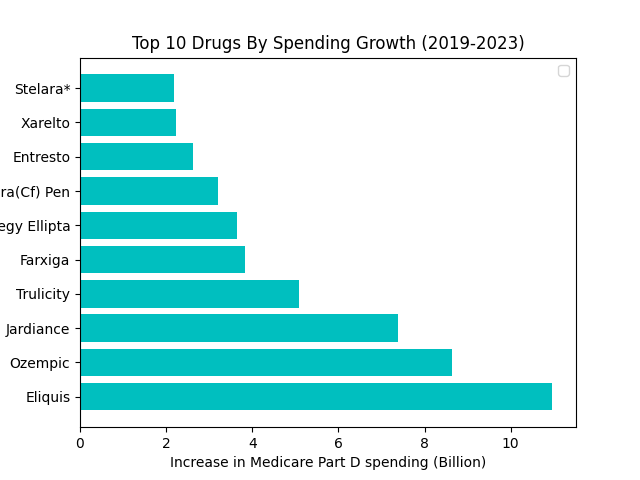
The bar chart shows that Eliquis is the biggest contributor to Medicare Part D spending over the years, followed by Ozempic. Stelara* is the tenth on the list. The difference between Eliquis and Stelara* is approximately $ 9 billion. The asterisk sign in Stelara indicates multiple routes of administration.
It also reveals that four out of ten drugs are used in the management of diabetes, which points towards the prevalence of type 2 diabetes in the population.
How much of the Total Spending came from these Drugs?
For a better understanding of the cost distribution, we would determine the total expenditure and the sum of expenditure of the top ten drugs.
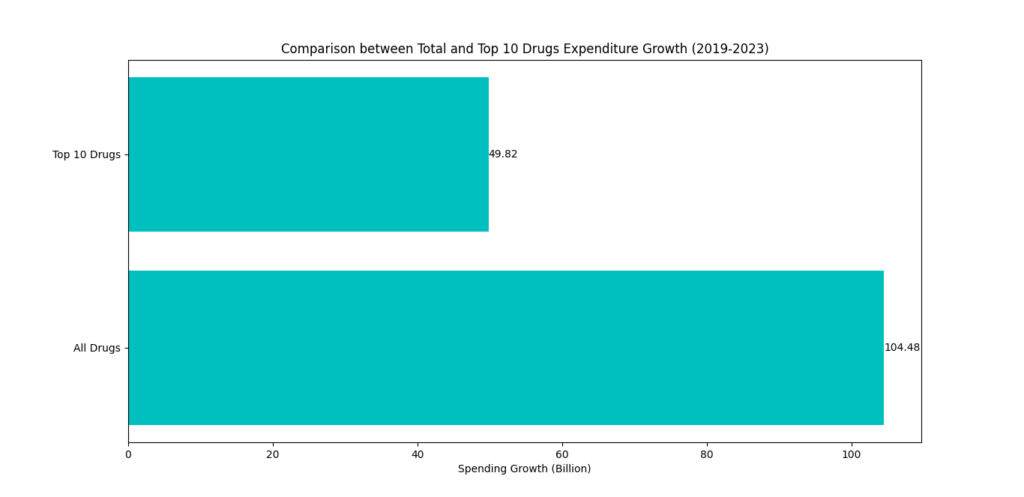
Medicare Part D spending increased by approximately $ 104.5 billion from 2019 to 2023. The top ten drugs in the list account for almost $ 50 billion of that growth. It shows that almost half of the total spending is attributed to a limited number of drugs, emphasizing the concentration of specialized medications.
Is Growth Due to Increased Cost or Increased Claims?
To understand the main cause of increased expenditures, we would determine the correlation between cost and prescription of the top ten drugs.
| Drug Name | Spending Growth (%) | Claims Growth (%) |
|---|---|---|
| Eliquis | 150.2 | 74.8 |
| Ozempic | 1564.4 | 1223.4 |
| Jardiance | 510.7 | 350.0 |
| Trulicity | 224.0 | 148.6 |
| Farxiga | 754.6 | 568.9 |
| Trelegy Ellipta | 442.5 | 320.7 |
| Humira(Cf) Pen | 266.6 | 161.0 |
| Entresto | 322.5 | 180.1 |
| Xarelto | 54.8 | 5.4 |
| Stelara* | 275.3 | 180.6 |
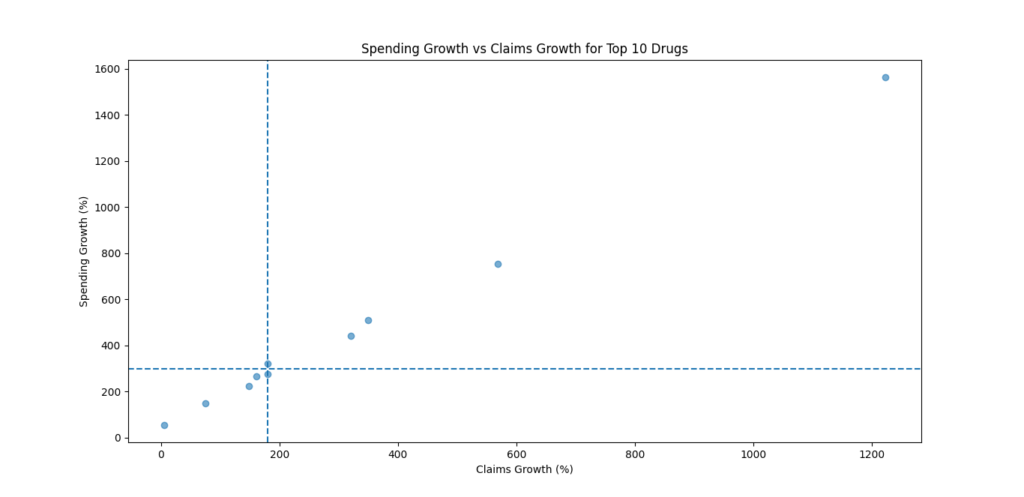
The vertical dotted line in the graph represents 180% claims growth, while the horizontal dotted line shows 300% spending growth. The drugs could be divided into four quadrants for the sake of interpretation and explanation.
1: Upper Right Quadrant:
High Spending Growth+ High Claims Growth
The drugs in this quadrant show an increase in both utilization and cost over the years. These are:
- Ozempic
- Farxiga
- Jardiance
- Trelegy Ellipta
Ozempic shows an extraordinary growth of 1564.4% in spending and 1223.4% in claims. It is more than double the growth shown by the second drug (Farxiga).
The data analysis reveals that Ozempic is an outlier, leading the way and sitting far above the other drugs in the chart. This is an indicator of its massive growth as compared to other drugs.
2: Upper Left Quadrant:
High Spending Growth + Low Claims Growth
Drugs in this quadrant represent a significant increase in cost and low utilization growth. The scatter plot above shows that none of the top ten drugs fall in this category. Thus, it suggests that Medicare Part D is not spending on any expensive drug with reduced demand.
3: Lower Right Quadrant:
Low Spending Growth + High Claims Growth
Drugs in this quadrant represent low-cost and higher utilization growth. Medicare Part D spends more on these drugs because there was an increase in prescriptions for them. The absence of drugs in this quadrant might suggest that there is no highly prescribed drug that is not being covered by the Medicare drug program.
4: Lower Left Quadrant:
Low Spending Growth + Low Claims Growth
Drugs in this quadrant show relatively modest growth in both cost and utilization. These include:
- Humira(CF) Pen
- Trulicity
- Eliquis
- Xarelto
The above-mentioned drugs do not significantly affect Medicare Spending compared to the leading drugs.
Others:
Entresto and Stelara* are falling just around the standard lines. Both of these drugs could represent average utilization and spending. Their minor difference from the quadrant lines is not significant enough to qualify them for any of the four quadrants or to deem them as outliers.
Conclusion:
The analysis of the top ten drugs over the years provides useful insights into changing trends. The Medicare drug coverage program is people-oriented and caters to people’s needs. Anti-diabetics have emerged as clear winners in both increased expenditure and prescriptions. Ozempic’s extraordinary growth over five years is interesting and requires further investigation.
Methodology Appendix:
Data Source:
CMS Medicare Part D Spending By Drug Dataset (2019-2023)
Formulas:
Spending Growth:
Spending Growth Percentage:
Claims Growth Percentage:
Limitations:
- This analysis is based on Brand names. Generic names are not included.
- External factors such as inflation and allocated budget are not considered.
- This is a drug-level analysis that does not include patient data.
- It considers a small set of the population, i.e., those enrolled in the Medicare Part D program.
Leave a Reply