Medicare Part D spending increased from approximately $220 billion in 2019 to $326 billion over five years (2019-2023). It’s a significant increase of approximately 48%. In this post, we will explore the possible causes behind the increasing expenditure.
This analysis involves prescription volume, spending per prescription, and spending concentration among the top ten drugs in each year.
Drug Spending Factors Analysis:
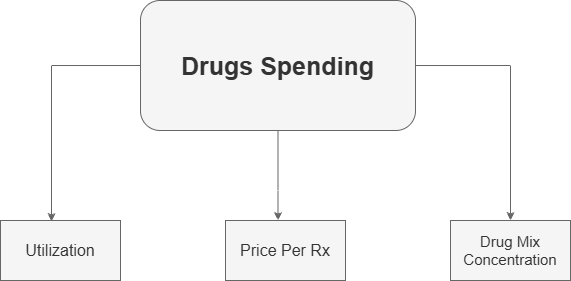
Increased expenditure could be attributed to the following factors:
- Increase in the number of prescriptions/claims
- Higher cost per prescription
- Expensive drugs forming a larger share of total spending
1: Utilization: Are More Prescriptions being filled?
Increased utilization might contribute to rising spending. It is worth examining whether the number of prescriptions or claims has increased over the years, leading to higher total expenditures.
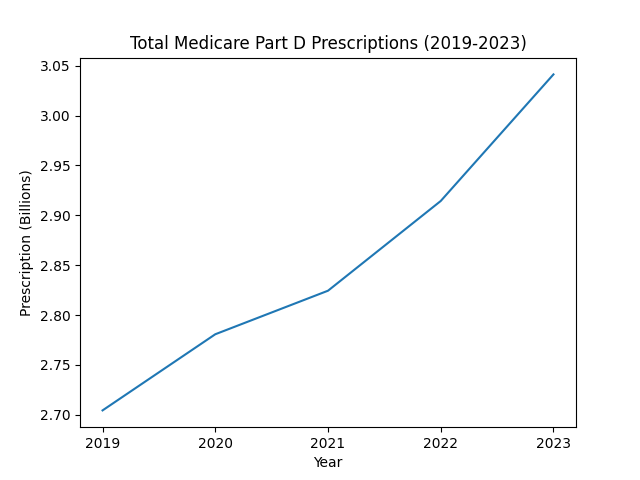
The graph shows a consistent yet modest growth in the total number of prescriptions over the years (2019-2023). Total claims have increased from 2.70 billion in 2019 to 3.04 billion in 2023. Thus, total utilization has increased by about 12.6%.
These findings suggest that even though drug utilization has increased over the years, the overall growth is less dramatic than the increase in total drug spending over the years. If utilization were the primary factor, both claims and spending would have shown similar growth trends. The significant gap between the two suggests that additional factors are involved in spending growth.
2: Cost Effect: Are Prescriptions Becoming More Costly?
An increase in cost per prescription could contribute to overall spending. Let’s find out the average prescription expenditure.
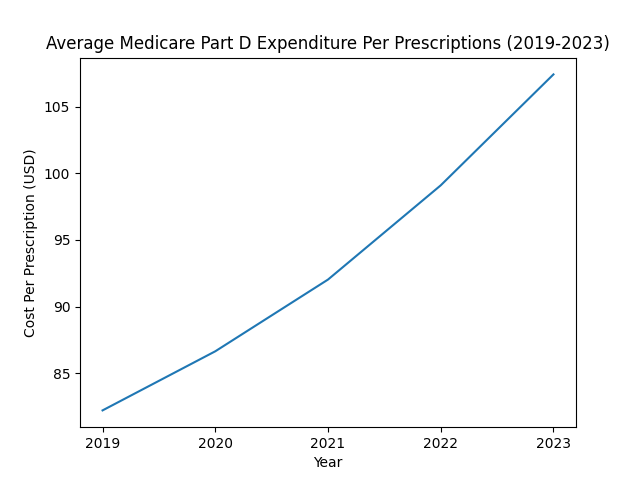
The chart shows a consistent increase in average per-prescription spending over the years. An increase of approximately 30.5% is observed.
It can be seen that average prescription costs for Medicare were substantially higher in the latter years than back in 2019. Growth in spending per prescription is more significant relative to the increase in prescription volume.
3: Drug Mix Effect: Is Spending Becoming More Concentrated?
A smaller number of expensive drugs could account for a larger share of total spending. This could potentially increase overall expenditure.
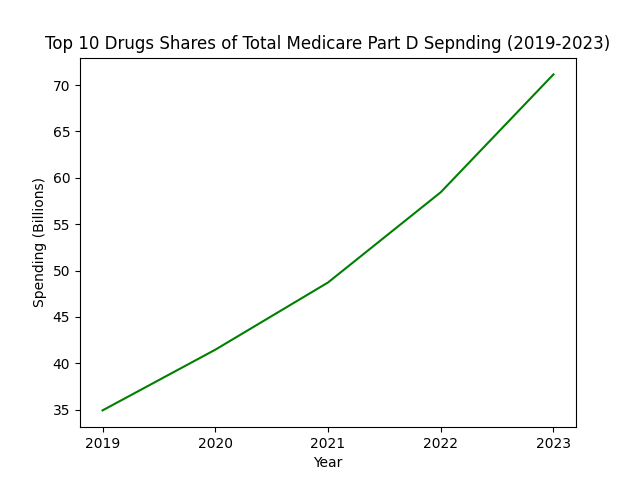
The graph shows a consistent increase over time. In 2019, the top ten drugs accounted for almost 16% of the total drug spending, which has significantly increased to 21.7% in 2023.
The data show that overall spending is not equally distributed among all drugs. A small number of drugs account for a large portion of Medicare Part D spending. This finding is consistent with the trend of increased use of specialty medications and other high-cost therapies.
Comparison of Driving Factors:
We have separately examined various possible contributing factors, such as utilization, cost per prescription, and the top ten drugs’ shares. Now it’s time for a collective comparison to get a bird’s-eye view.
To compare trends with different units (dollars, prescriptions, and dollars per prescription), each metric was converted to an index where 2019 = 100. Values above 100 indicate growth in comparison to 2019. For example, an index value of 134 represents an increment of 34% as compared to 2019.
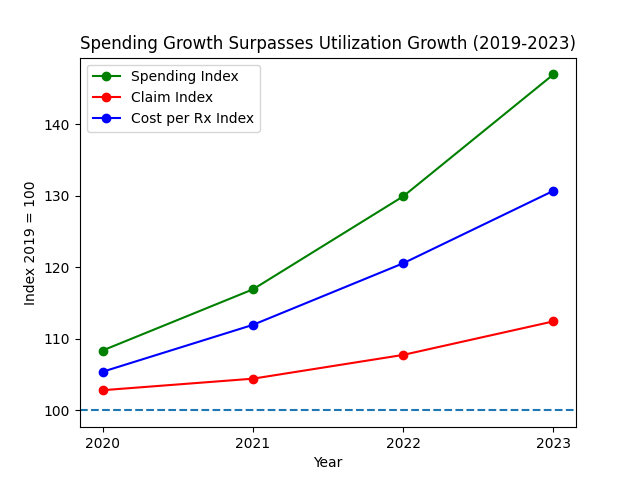
The values for 2023 are:
| Metric | Index |
|---|---|
| Spending | 147 |
| Cost Per Prescription | 131 |
| Claims | 112 |
The following patterns can be observed:
- The spending trend shows the fastest growth.
- Cost per prescription showed significant growth compared to claims.
- There is a modest increase in the number of claims.
Conclusion:
Medicare drug coverage program total spending has increased over the years, marking a substantial growth of 48% from 2019 to 2023. The data analysis further revealed that:
- Prescription volume showed a modest growth rate.
- The average cost per prescription substantially grew over the years.
- A small number of drugs accounted for a large share of total spending.
In conclusion, the massive increase in Medicare Part D spending could be attributed to per-prescription costs and the concentration of fewer expensive drugs used in specialized treatments. Changes in prescription volume do not play a significant role.
These findings indicate that analysis of future Medicare Spending would require special attention to the treatment plans that account for a disproportionate share of total expenditures.
Methodology Appendix:
- Data was obtained from the CMS Medicare Part D Spending by Drug dataset for 2019–2023.
- Total spending and total claims were aggregated annually across all drugs.
- Cost per prescription was calculated as total spending divided by total claims.
- Spending concentration was measured as the share of annual spending attributable to the ten highest-spending drugs in each year.
- Indexed growth figures use 2019 = 100 as the baseline.
Limitations:
Some of the limitations are:
- The results are based on the official CMS dataset only and are limited in scope.
- Inflation and the Medicare budget were not taken into account during the analysis.
- Cost per prescription is a broad term. It doesn’t differentiate between cost increases and changes in treatment plans.
- It is a descriptive analysis without proving any causality.
Leave a Reply